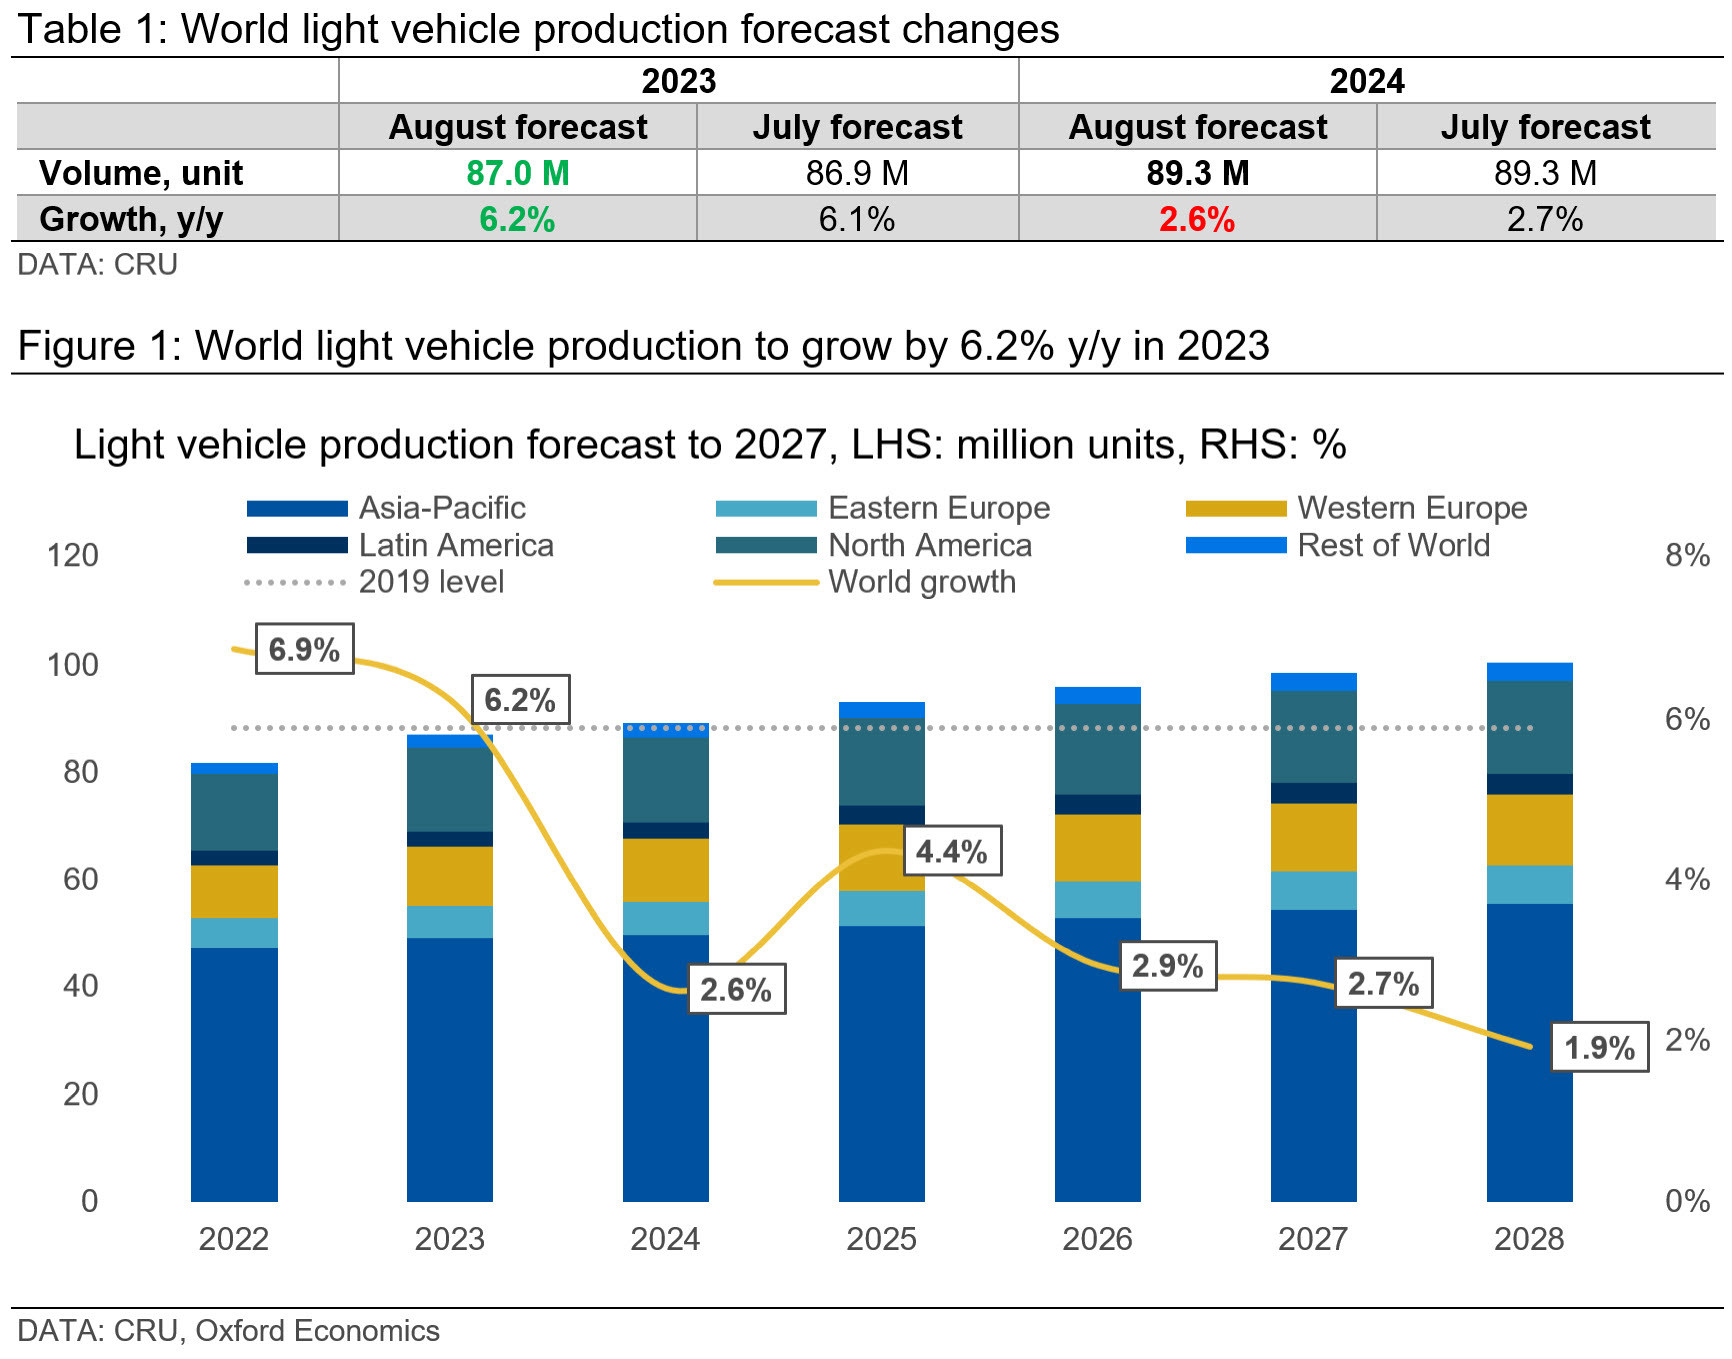
As global growth recovers, growth in auto production again picks up in 2025. After that, it settles back to a trend growth rate of just under 3%.
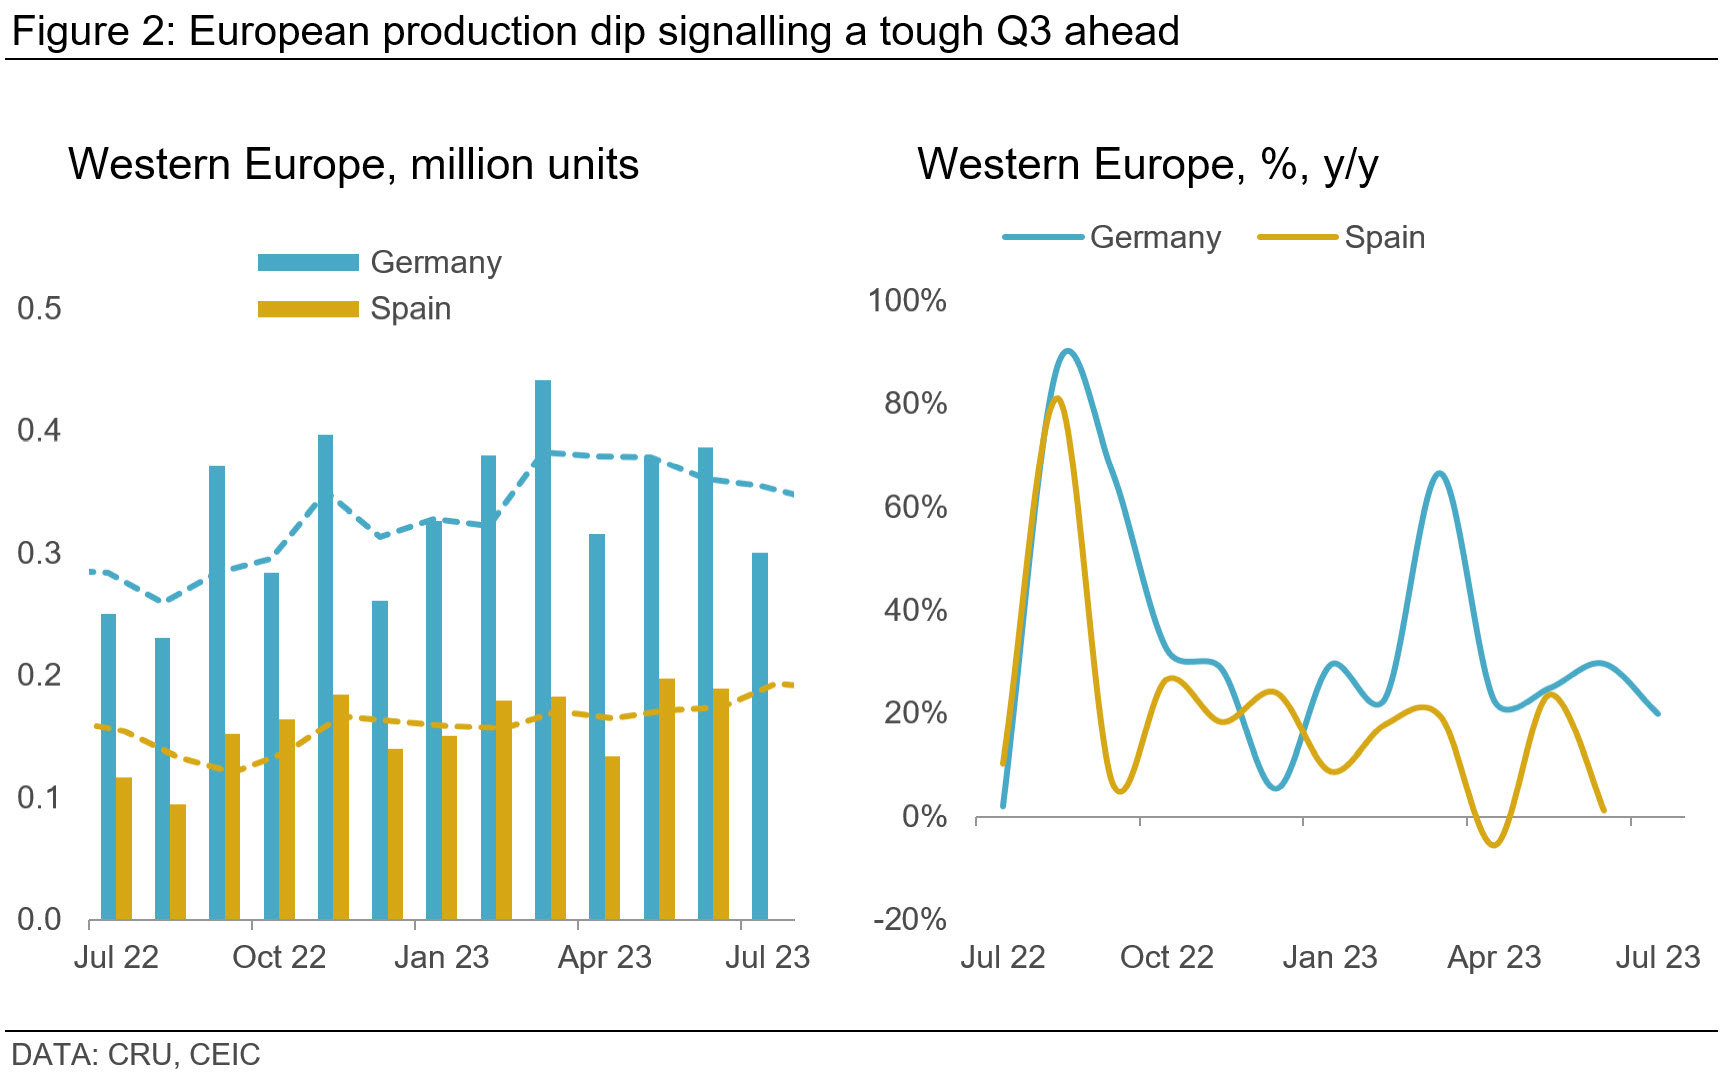
Europe may face Q3 stumble beyond seasonal trends
The third quarter is usually a soft spot in Europe's auto production calendar. This year Q3 is complicated by added macroeconomic challenges. It's becoming evident that Q3 might see weakness that is more than just seasonal.
Germany, in particular, saw mixed outcomes in July. Although passenger car production increased by 20% y/y, there was a noticeable month-on-month slowdown. Year-to-date (YTD) production climbed by 31%, but still trailed 11% behind 2019 levels for the same period. On a brighter note, Germany shone in Battery Electric Vehicle (BEV) and Plug-in Hybrid Electric Vehicle (PHEV) production. In 2023 H1, 673 K electric vehicles were produced—a remarkable 93% y/y increase. Germany surpassed the US in electric vehicles production during this period, clinching the second spot globally.
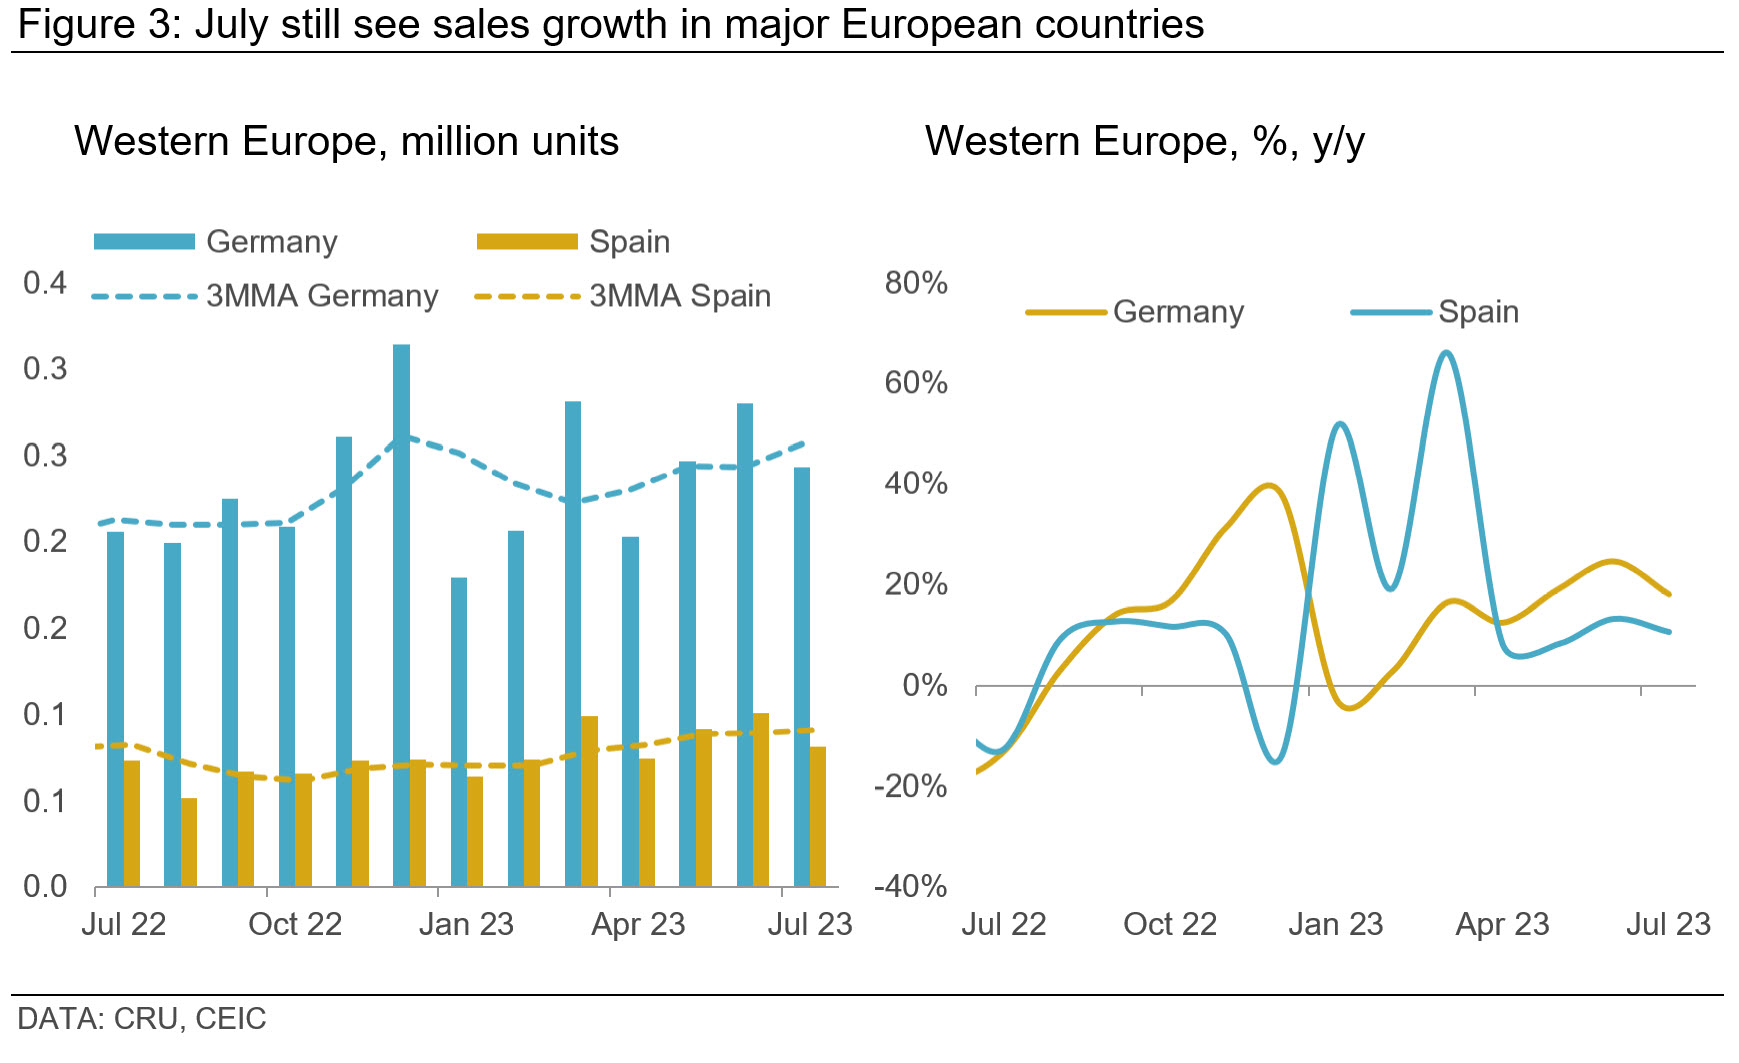
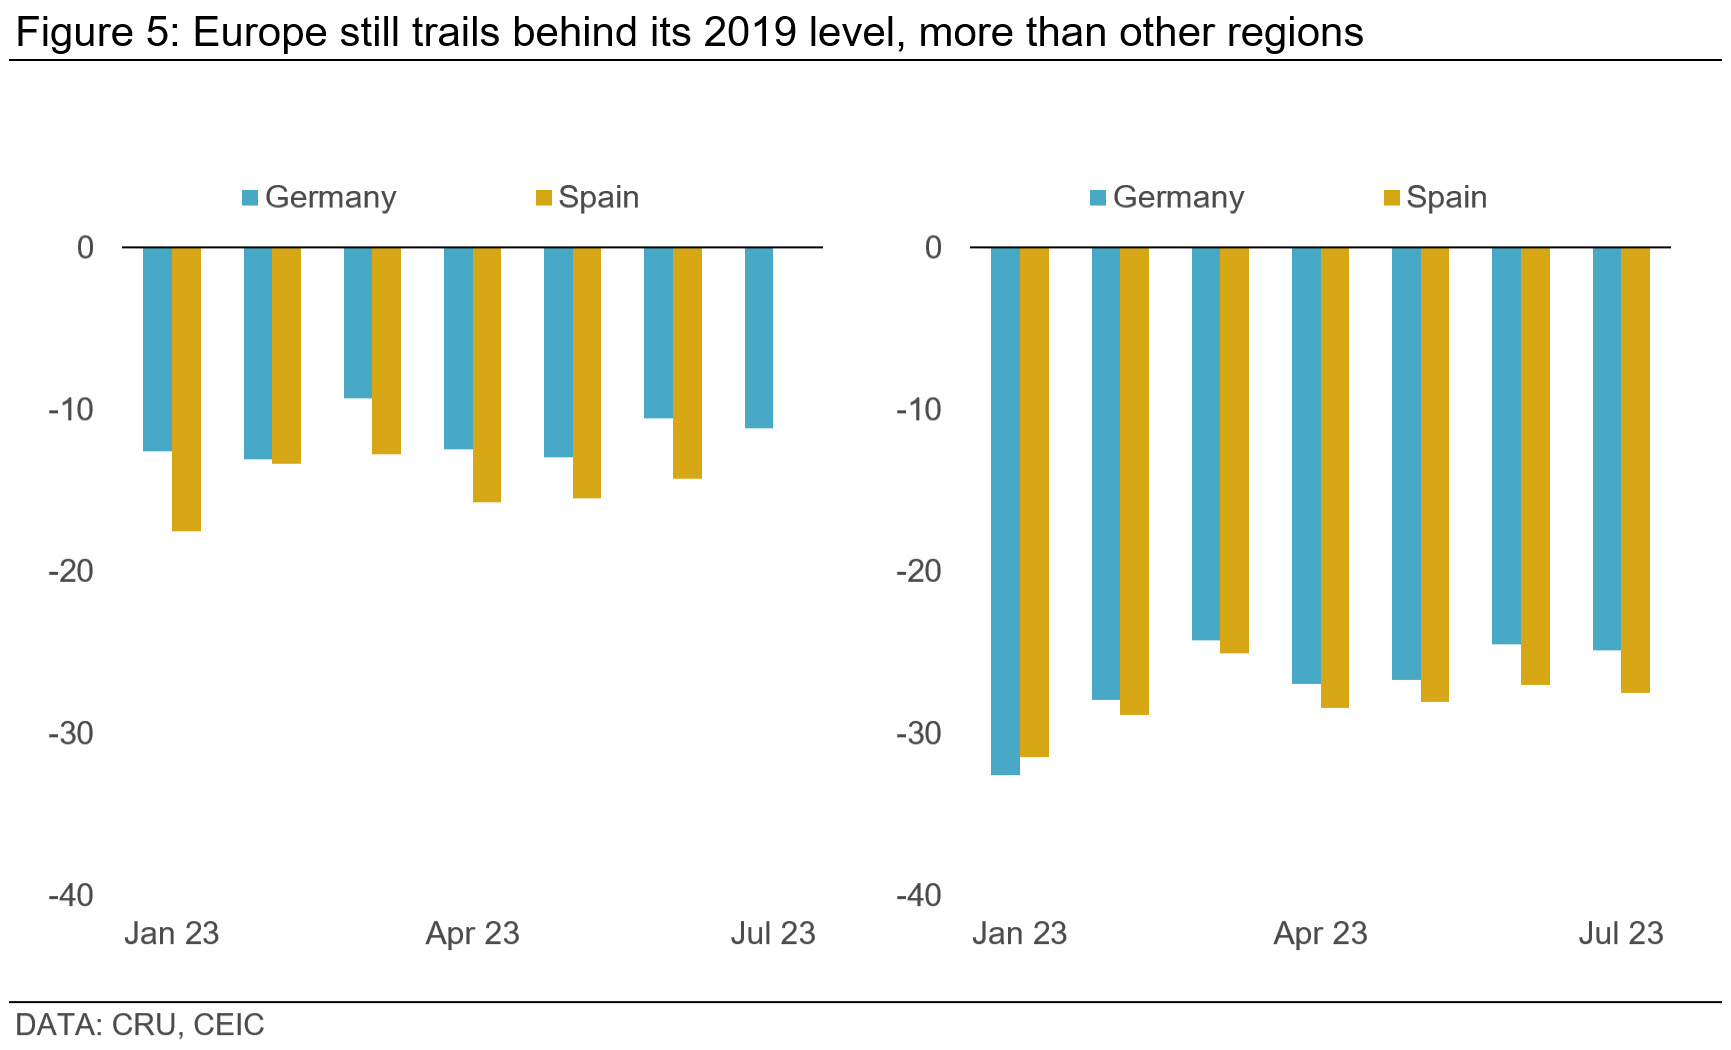
Registration data across major European markets in July were upbeat. Germany's new car registrations increased by 18% y/y, France by 19.9% y/y, Spain by 10.7% y/y, and Italy by 8.7% y/y. But this silver lining has a cloud; compared to pre-crisis 2019 levels, YTD new registrations across major markets are on average down by over 25%.
In a broader EU context, July marked the twelfth consecutive month of growth in passenger car registrations, with a 15% y/y increase. By this point, the YTD volume reached 6.3 M units, indicating a growth of 17.6% y/y. Yet, this figure still trails by 22% when compared to 2019.
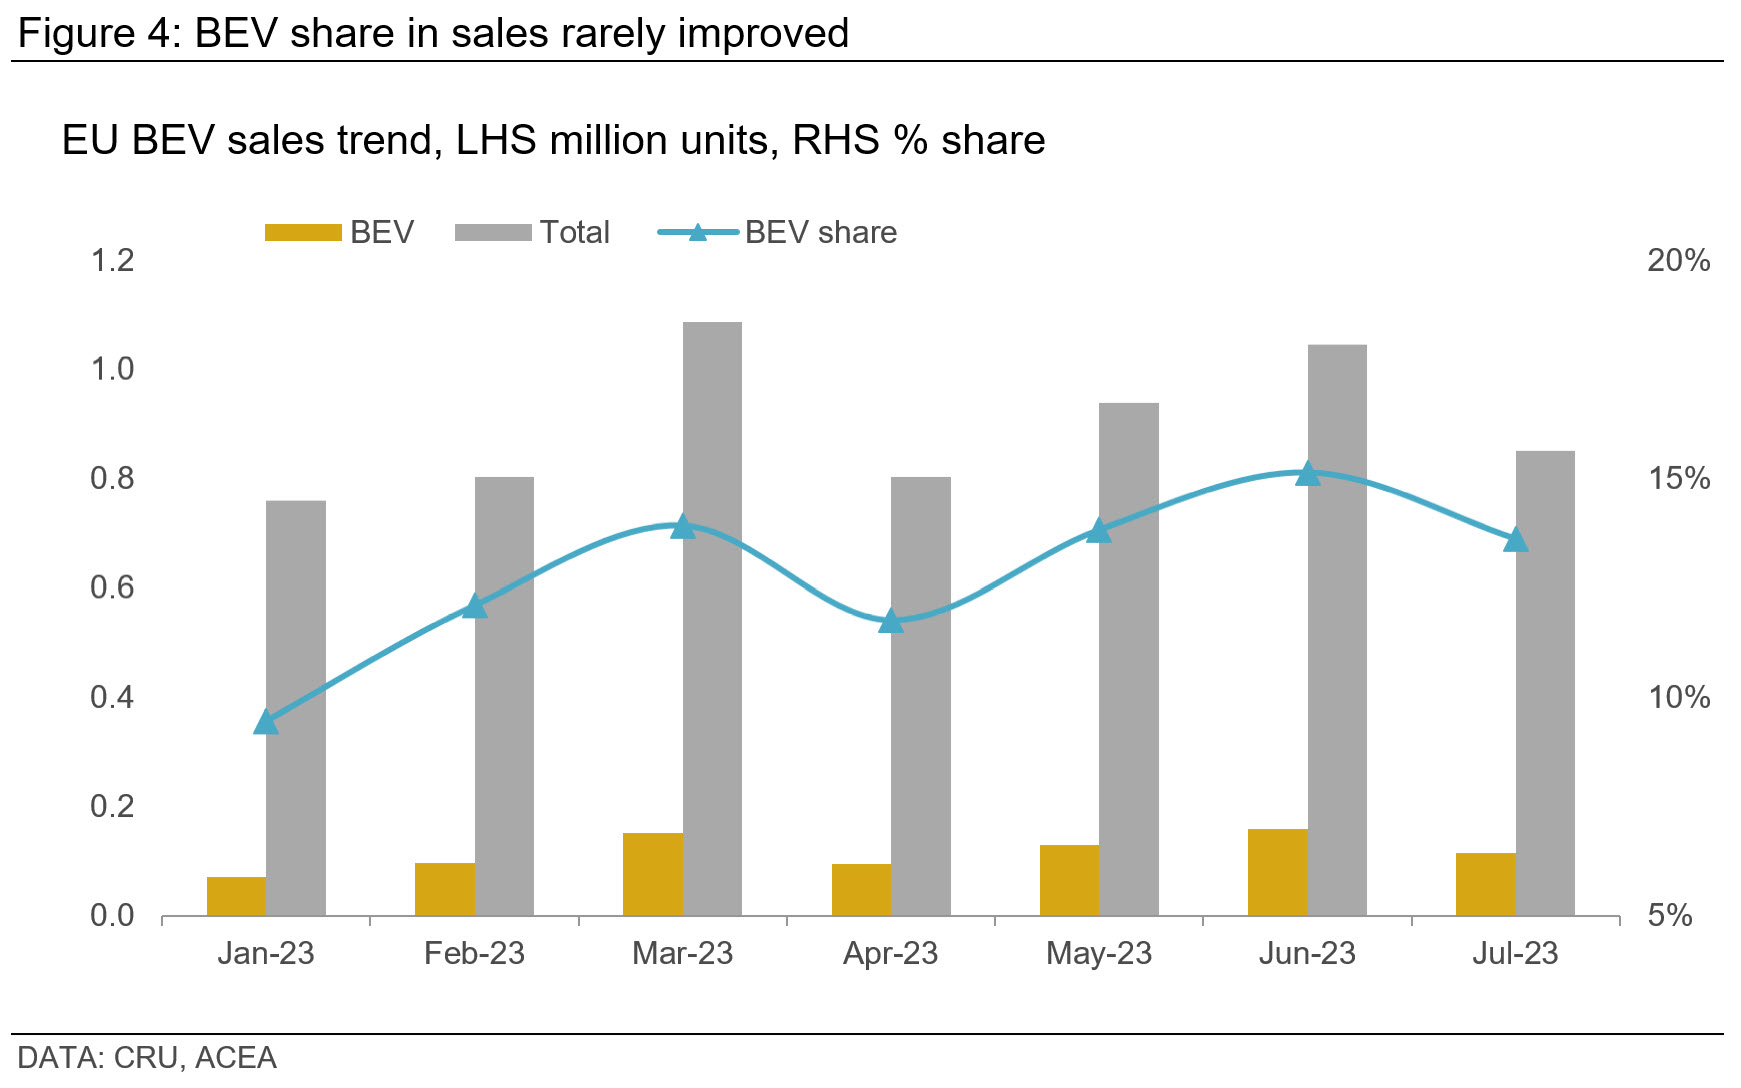
BEV registrations in July for the EU have been encouraging. A substantial 60.6% y/y increase brought the figure to 116 K units, which now accounts for 13.6% of the market. Several EU countries reported significant growth rates, with registrations in Belgium soaring by 236% y/y, Germany by 69%, and France by 32%. Yet, while YTD BEV sales in the EU have risen nearly 55% y/y, market share has not progressed decisively. Notably, major markets have observed BEV sales stagnate or even decline recently.
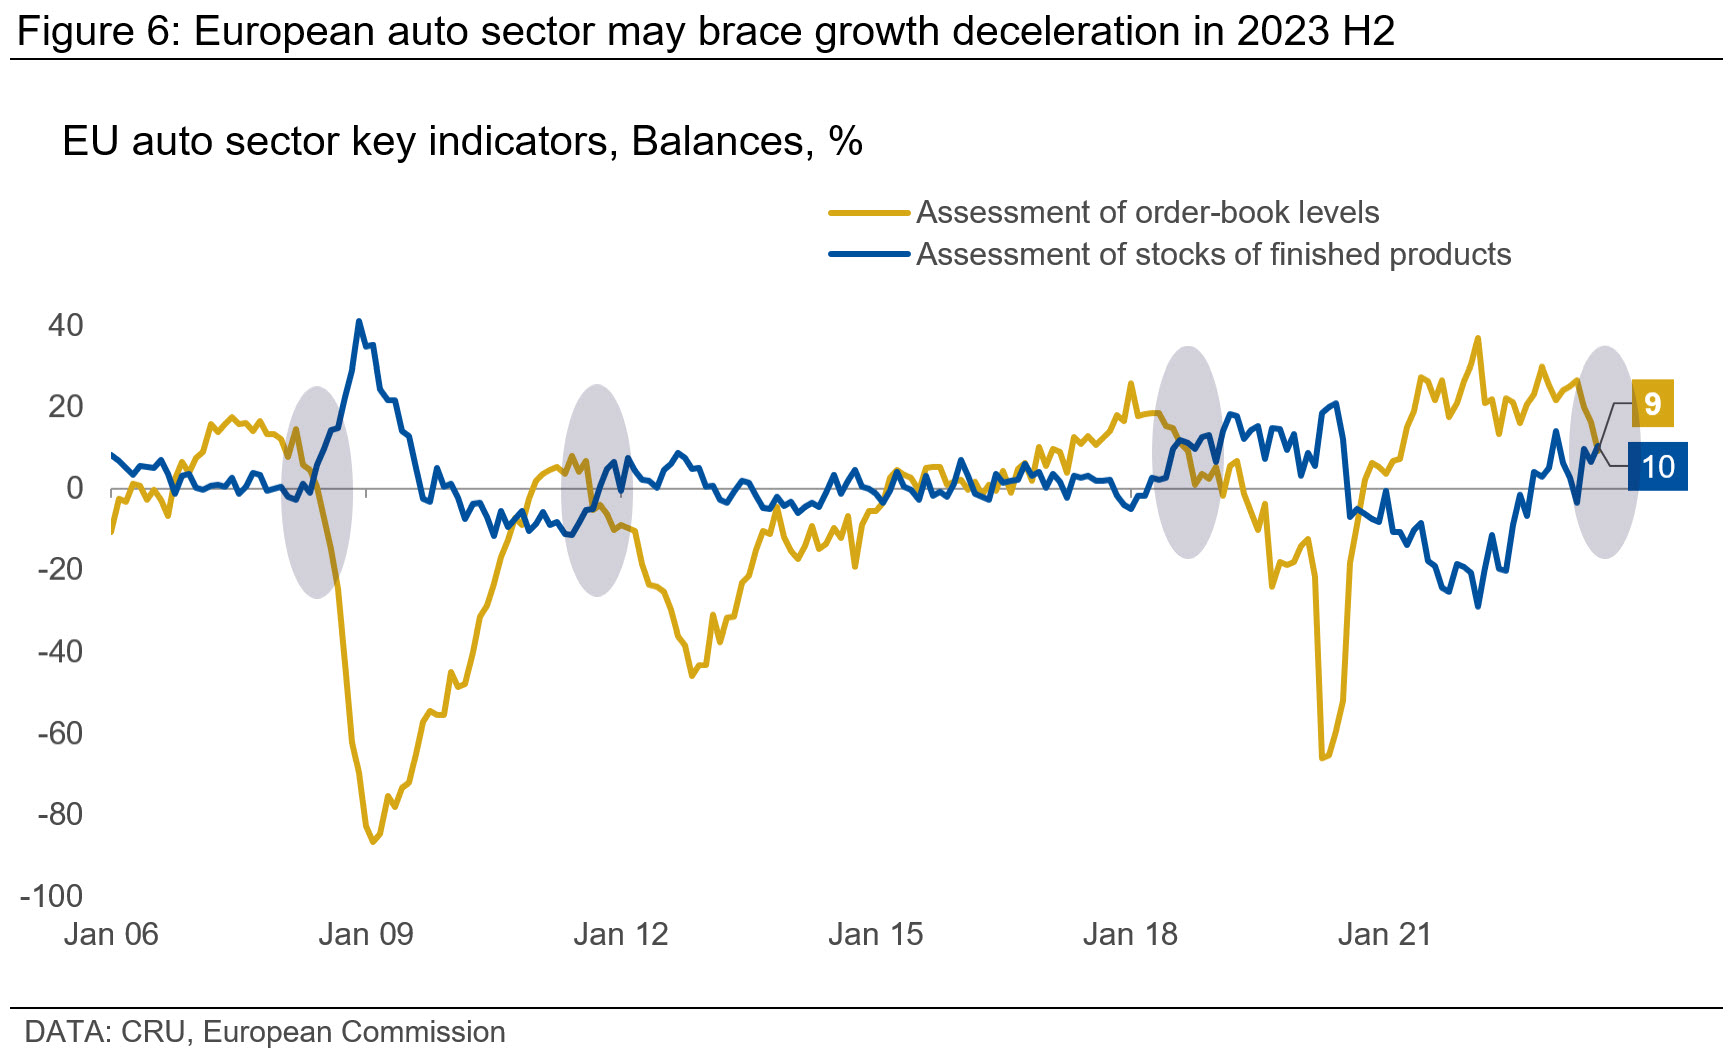
Several concerning signals emerged from the EU auto sector in July. Order book levels witnessed a sharp downturn, marking the fourth consecutive month of decline and hitting the lowest point since Mar 2021. Inventory levels swelled, reaching the second highest peak last observed in Jul 2020. Similarly, confidence indicators plummeted to the lowest level since July 2020. This is the fourth time that a falling order book index together with surging inventory levels since 2006; each previous instance correlated with significant market downturns.
The complexities of Q3 could be more than just seasonal. Economic headwinds coupled with mixed performance indicators signal a bumpy road ahead for Europe's auto industry.
North America has a smoother road ahead than Europe
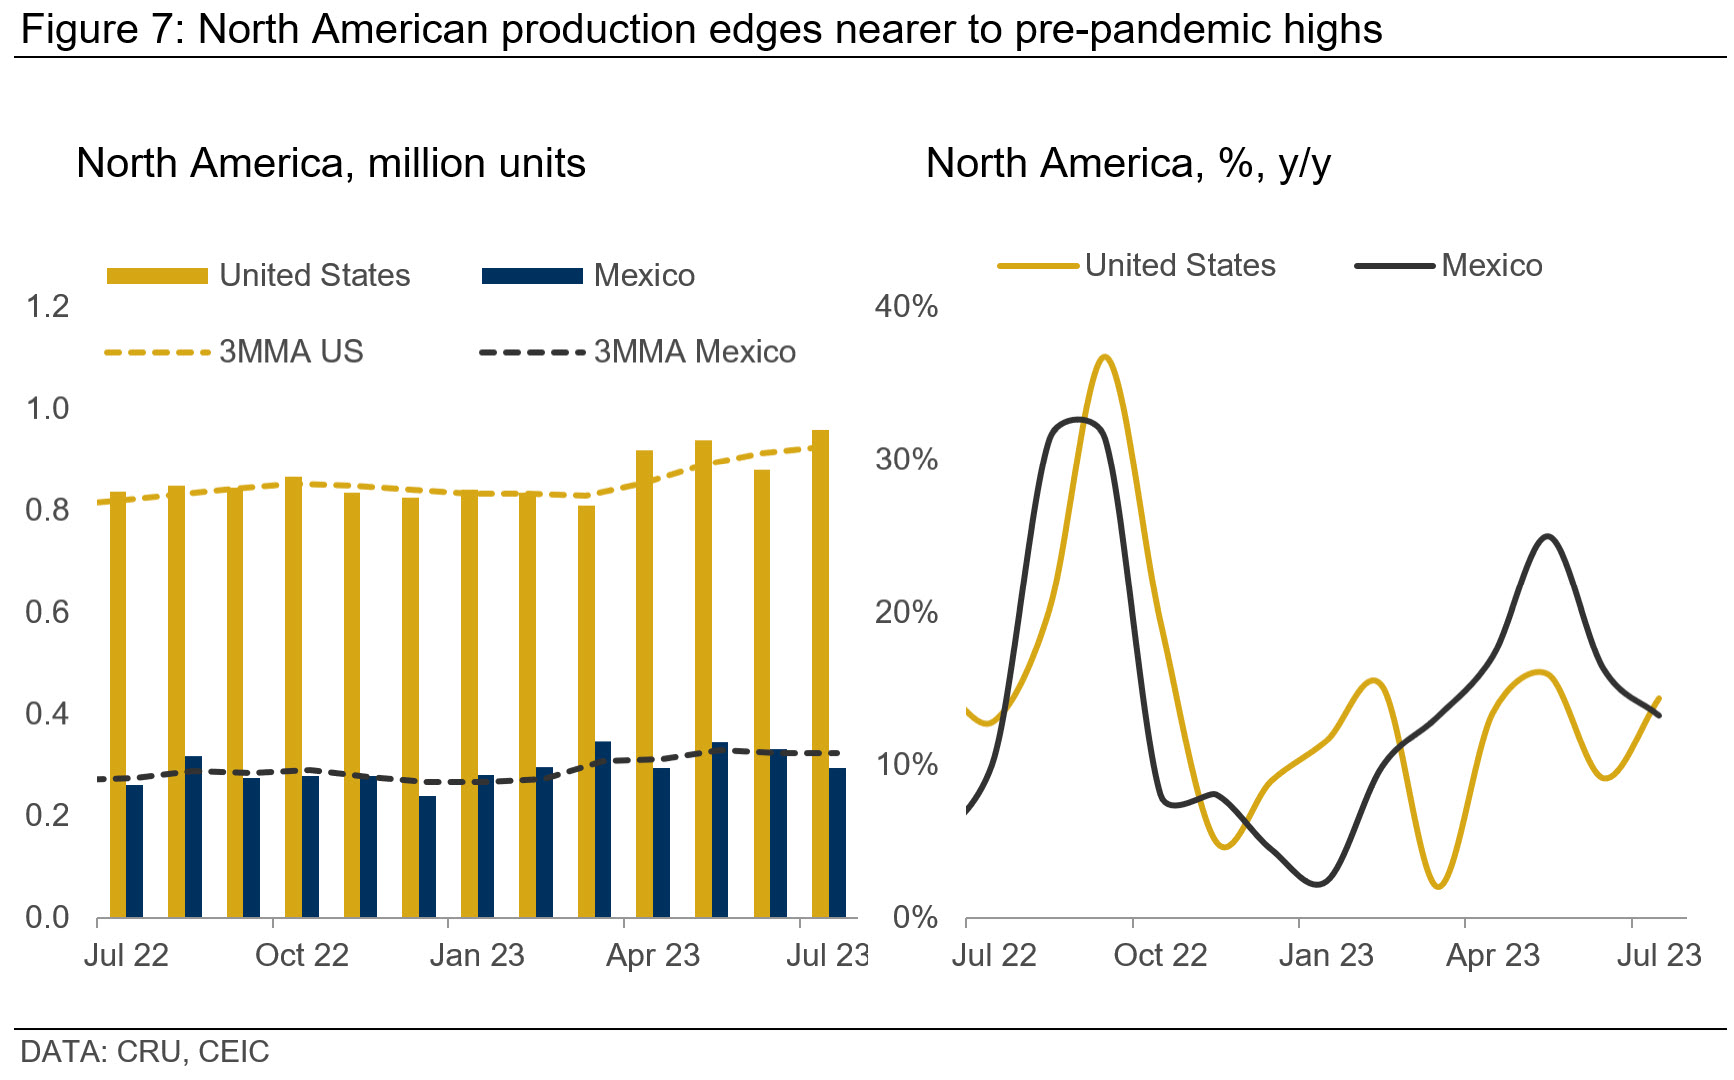
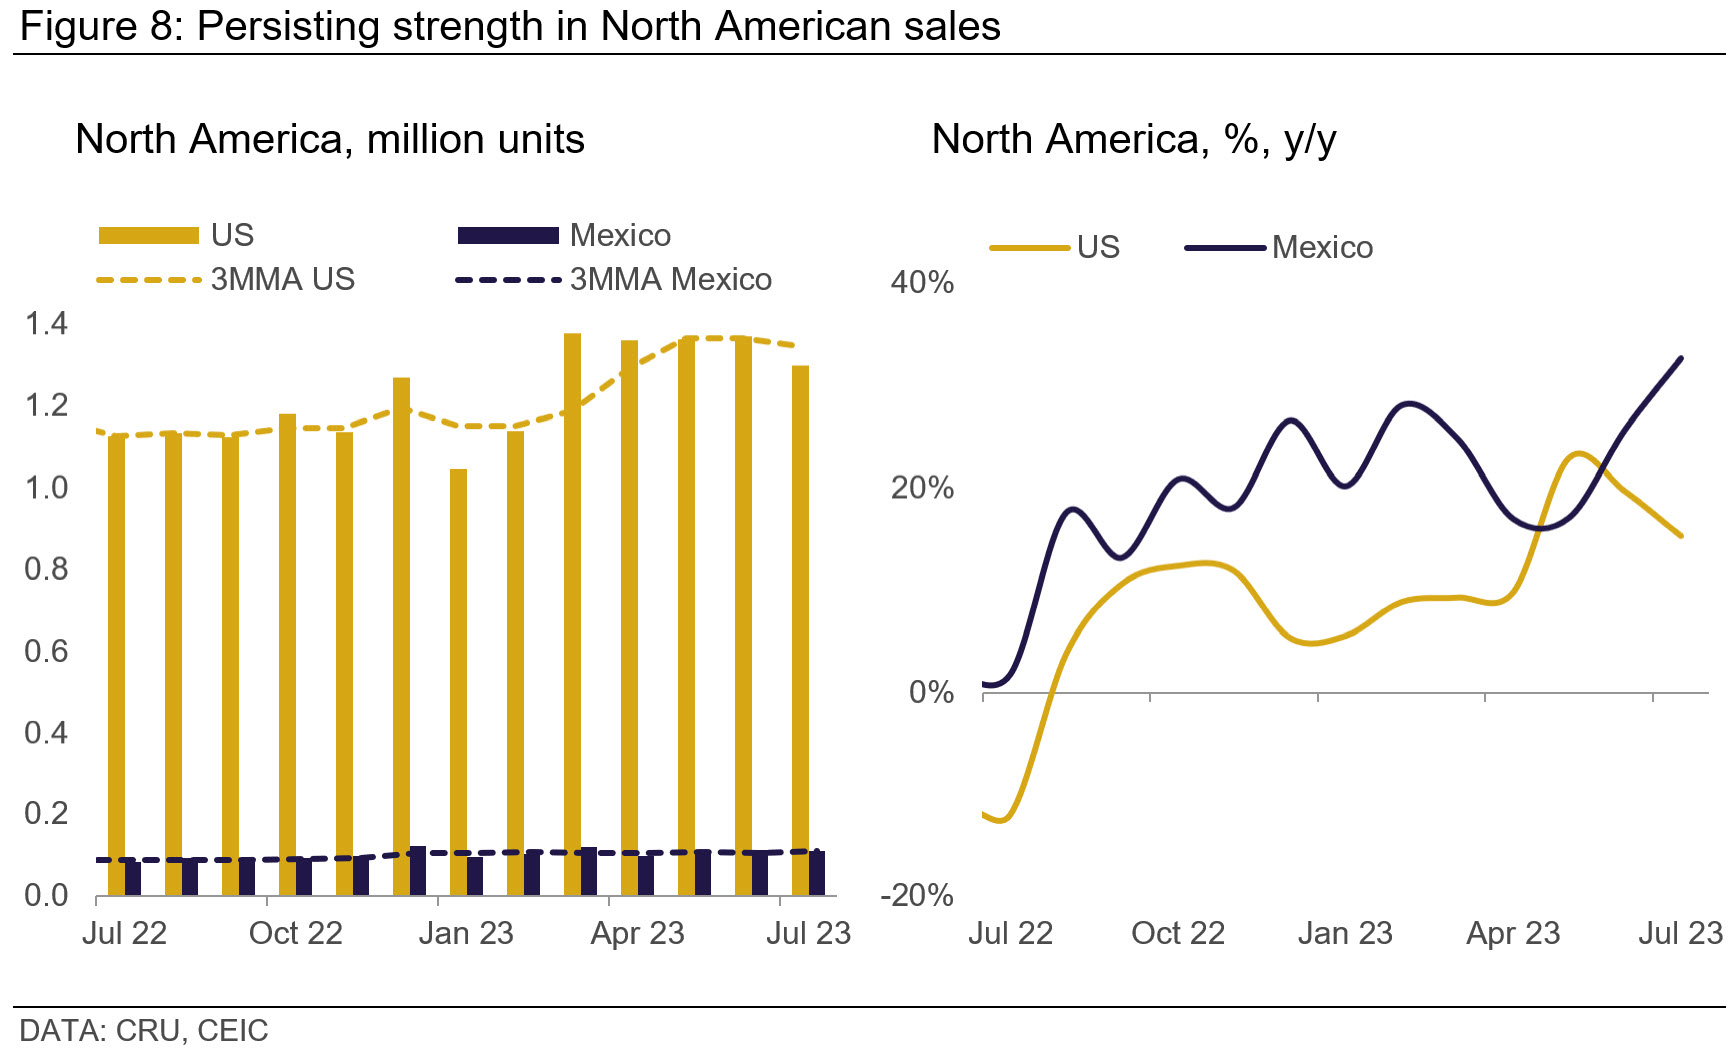
In contrast to the uncertainties clouding the European market, North America, especially the US and Mexico, showed continued resilience in July. US light vehicle (LV) production surpassed its three-month moving average (3MMA). While Mexico dipped below its 3MMA, year-on-year statistics still underscore a favourable growth trend. Both markets exhibited a double-digit year-on-year growth.
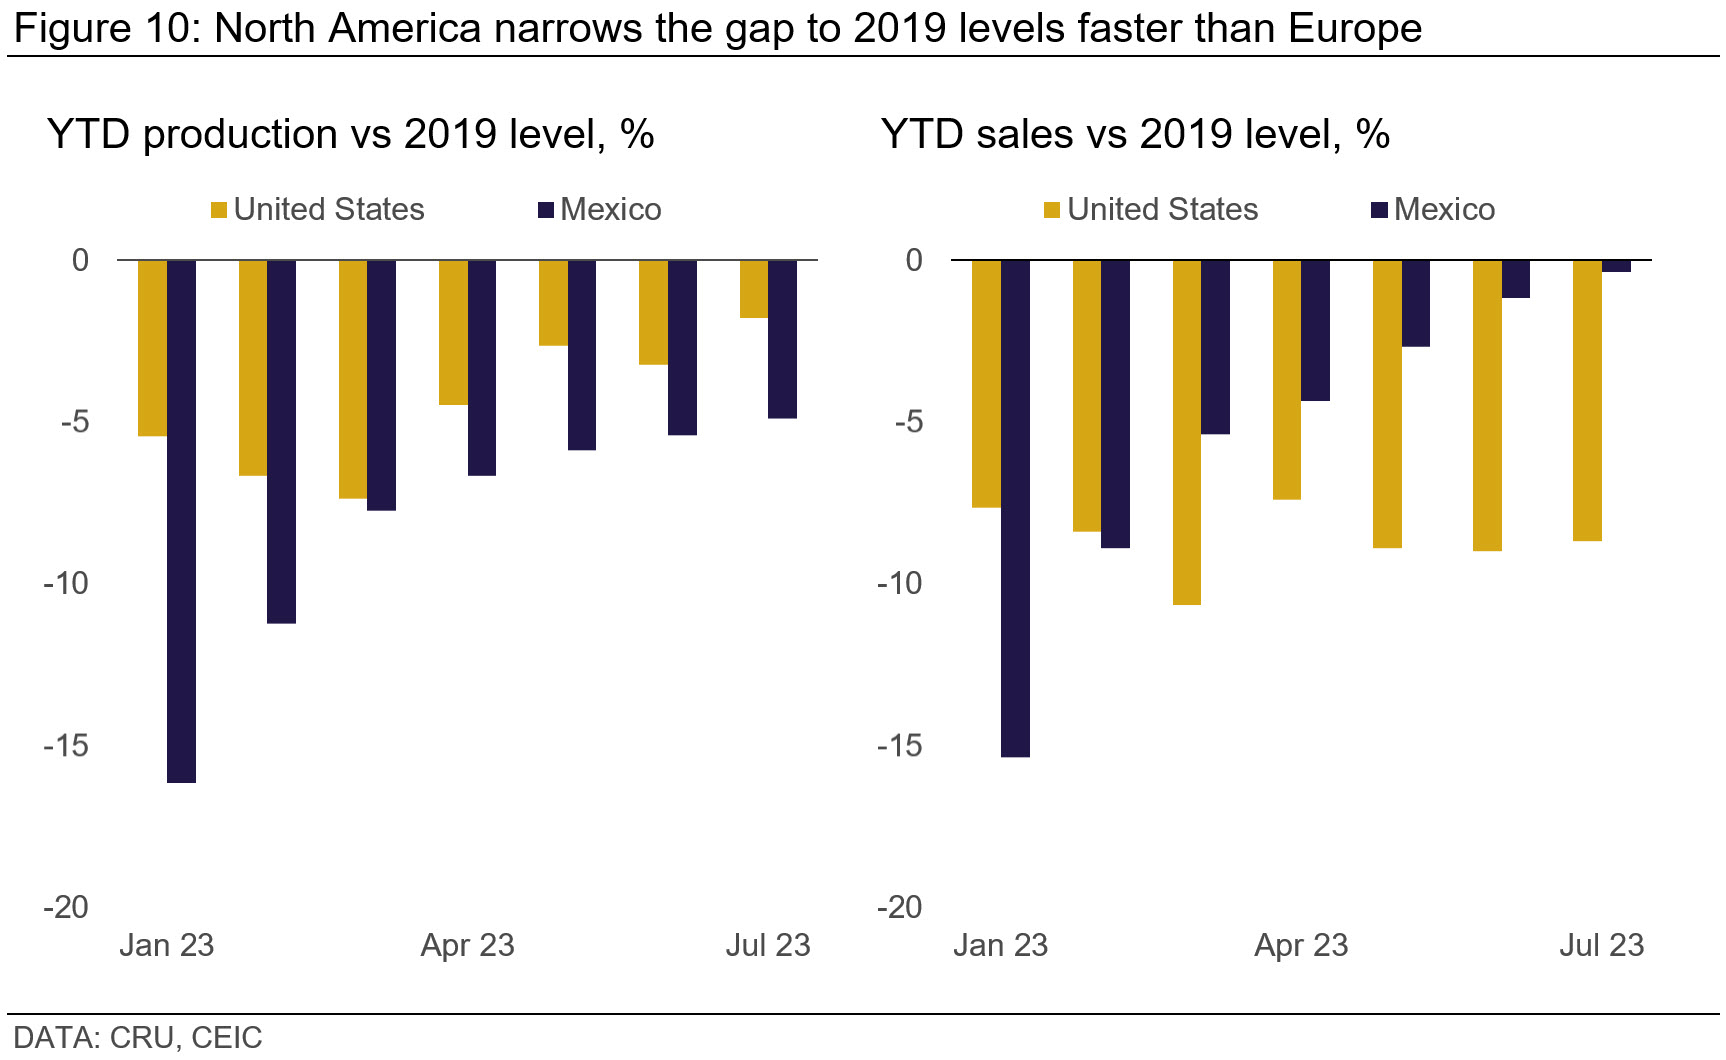
In year-to-date comparisons, the US has ramped up its LV production by approximately 12% from last year, while Mexico boasts an increase of roughly 14%. While these gains are commendable, production levels have yet to match those seen in 2019. The US is just 1.8% shy of its 2019 levels, whereas Mexico lags by 4.9%. Nevertheless, North America's resilience sets it ahead of its European counterparts.
Yet, the horizon isn't without its clouds. Detroit's big three automakers face potential strikes that could disrupt production. In a high impact scenario, strikes against all three could carve out a production gap of up to 1.5 M units. This could set the stage for a 2024 production rebound, but LV demand remains the wild card. Comparing potential strikes to those of 2019, the scales seem tilted unfavourably for automakers. They are grappling with leaner inventories, economic headwinds, and softening demand. Adding to the pressure-cooker environment is the union's significant $825 M war chest, capable of fuelling an 11-week strike. Such a prolonged strike is likely to eventually force a resolution, but any deal could, ironically, weaken Detroit's big three in the face of escalating labour costs and competition.
Sales figures for July present an encouraging narrative. US sales swelled by 15% y/y, while Mexico saw a staggering 33% growth. YTD figures also impress: the US sales increased by 13% and Mexico by 24% compared to the same period last year. The uptick in sales can be attributed to the highest new-vehicle inventory seen in over two years, coupled with robust fleet sales.
Kelley Blue Book highlights a modest uptick in the average transaction price (ATP) for new vehicles in July at $48,334, just a 0.4% increase y/y. Interestingly, since the year began, there's been a 2.7% drop in prices. July also marked an increase in manufacturers' incentives, reaching levels last seen in Oct 2021. New car affordability seems to be on the rise, but looming macroeconomic factors might act as speed bumps in the months ahead.
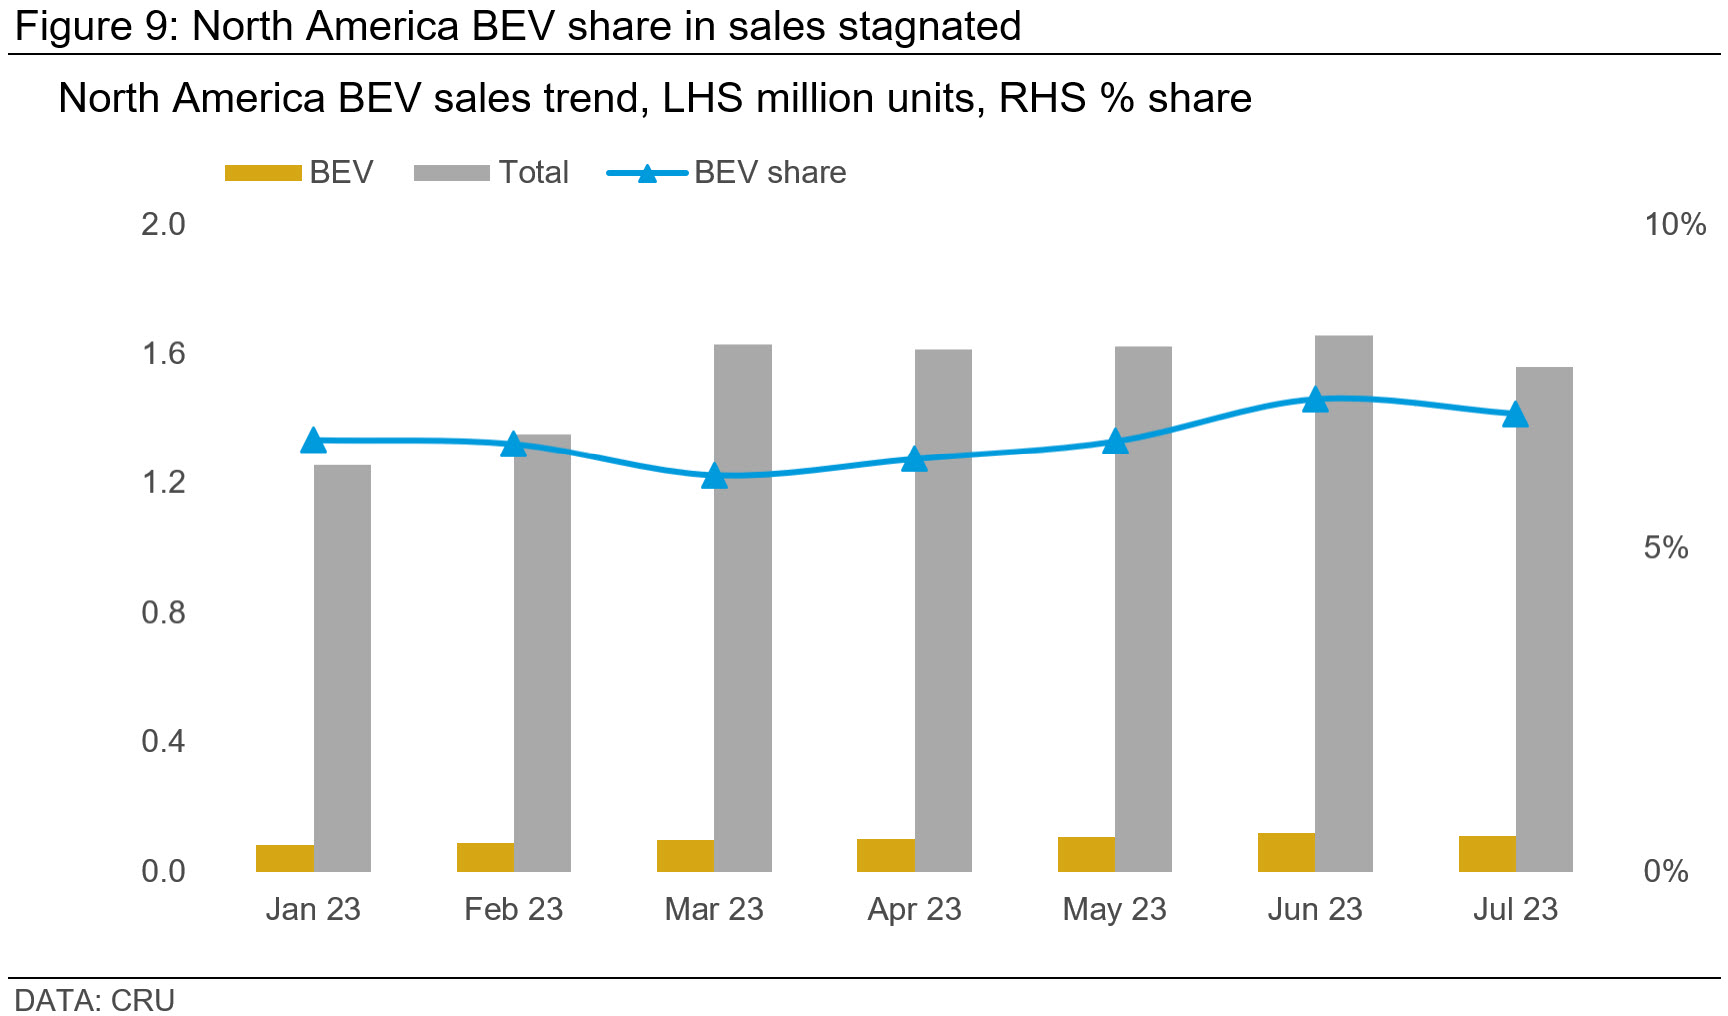
On the electric front, EV prices are dipping, led primarily by Tesla. July's EV ATP was $53,469, a decrease from both June and January. Even as manufacturers like Ford are joining the price-slashing bandwagon initiated by Tesla, profitability remains a concern for most, thanks to high BEV production costs and narrow margins. Given these factors, traditional Internal Combustion Engine (ICE) or hybrids may remain attractive for consumers. North America's EV market share seems to be going nowhere fast, holding at 7% in July – a figure that lags behind Europe and China.
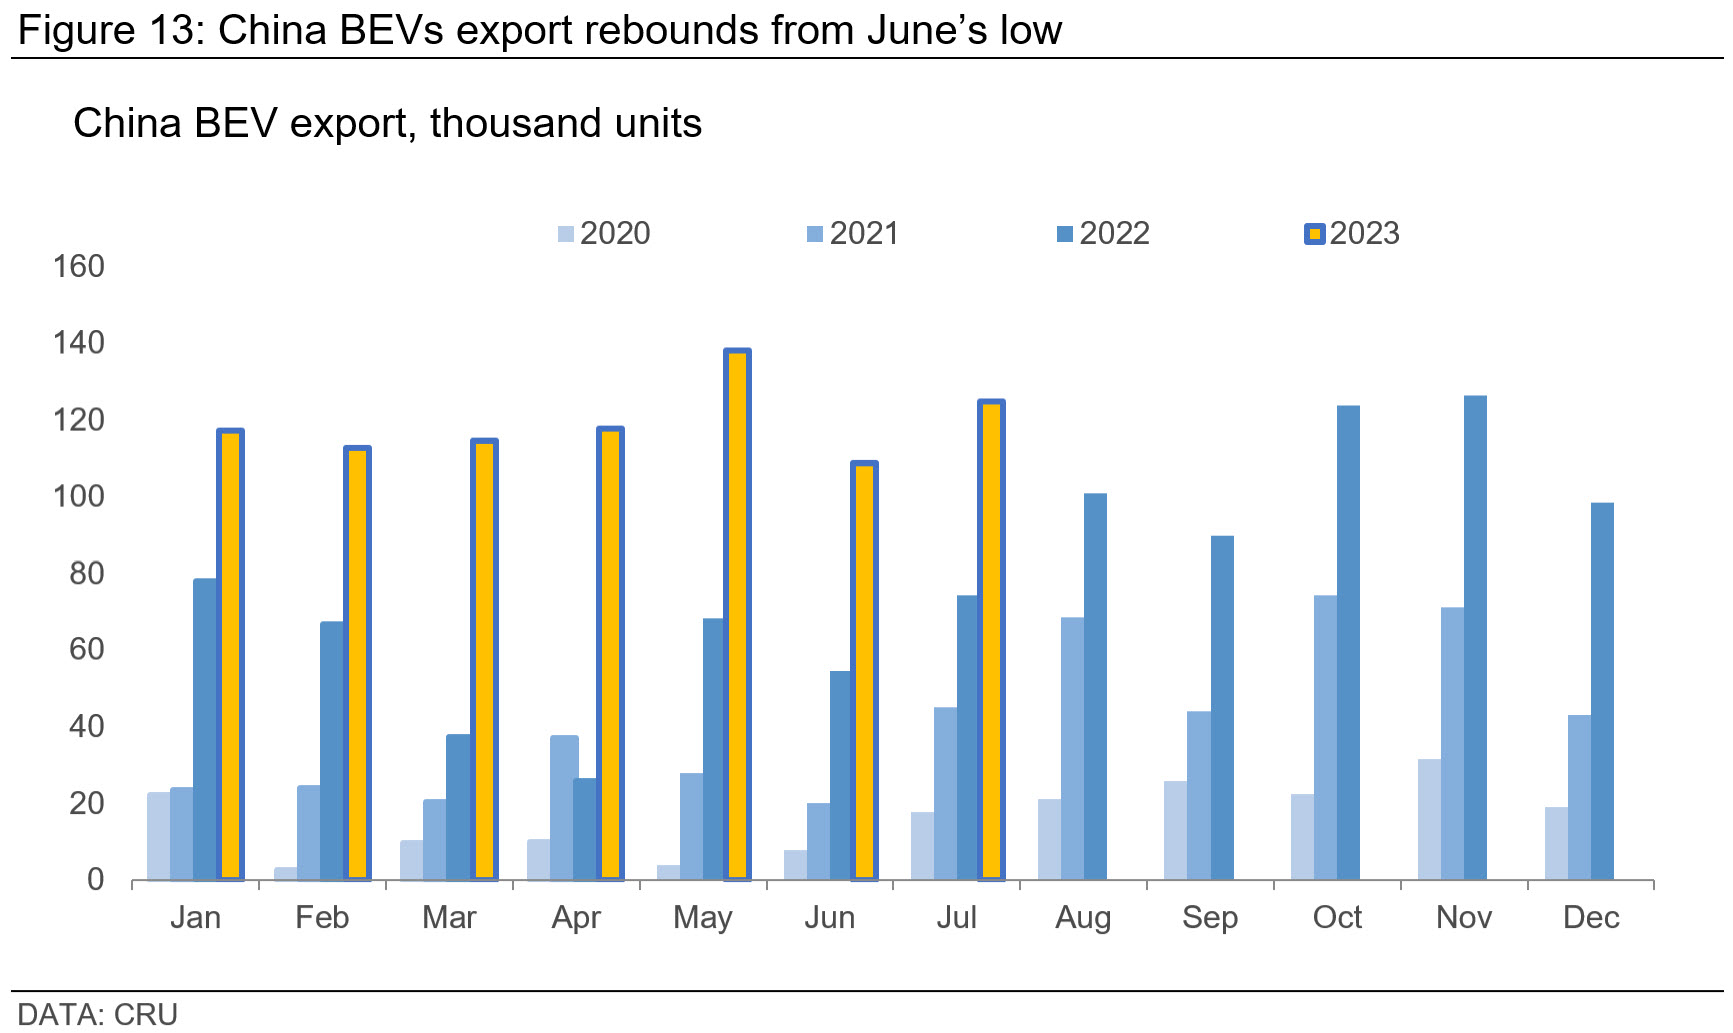
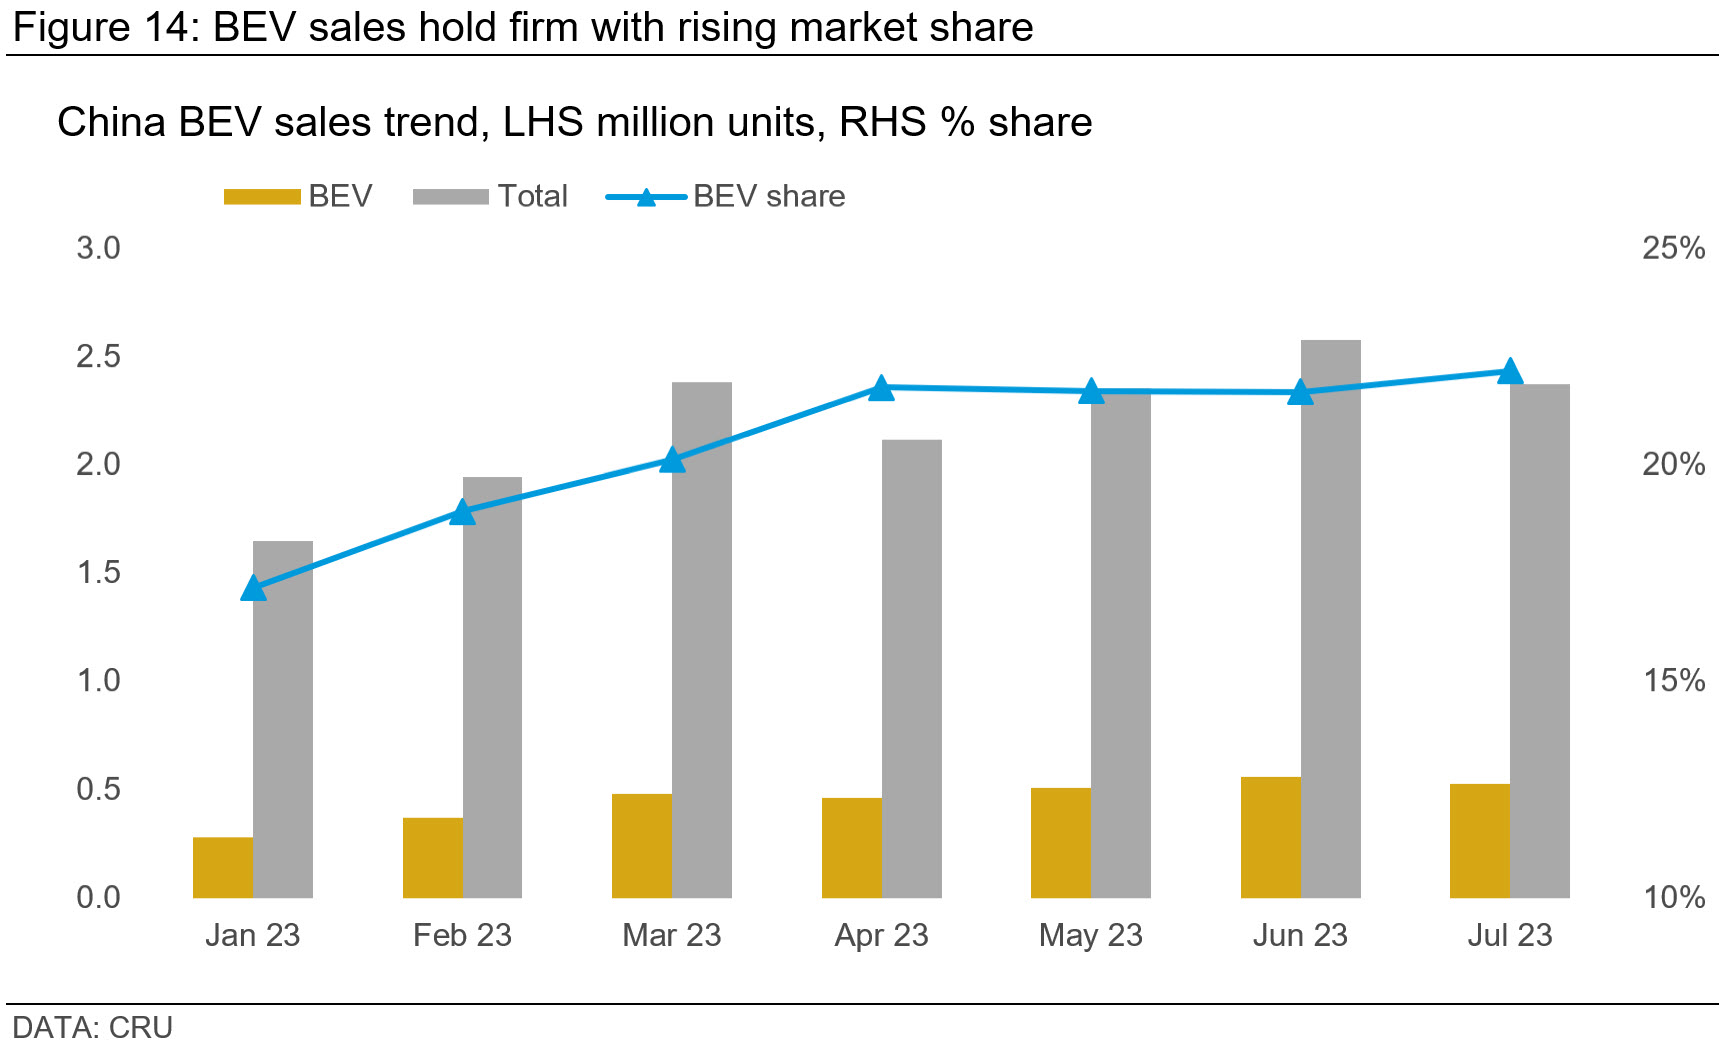
China’s domestic slump offset by robust exports and EV growth
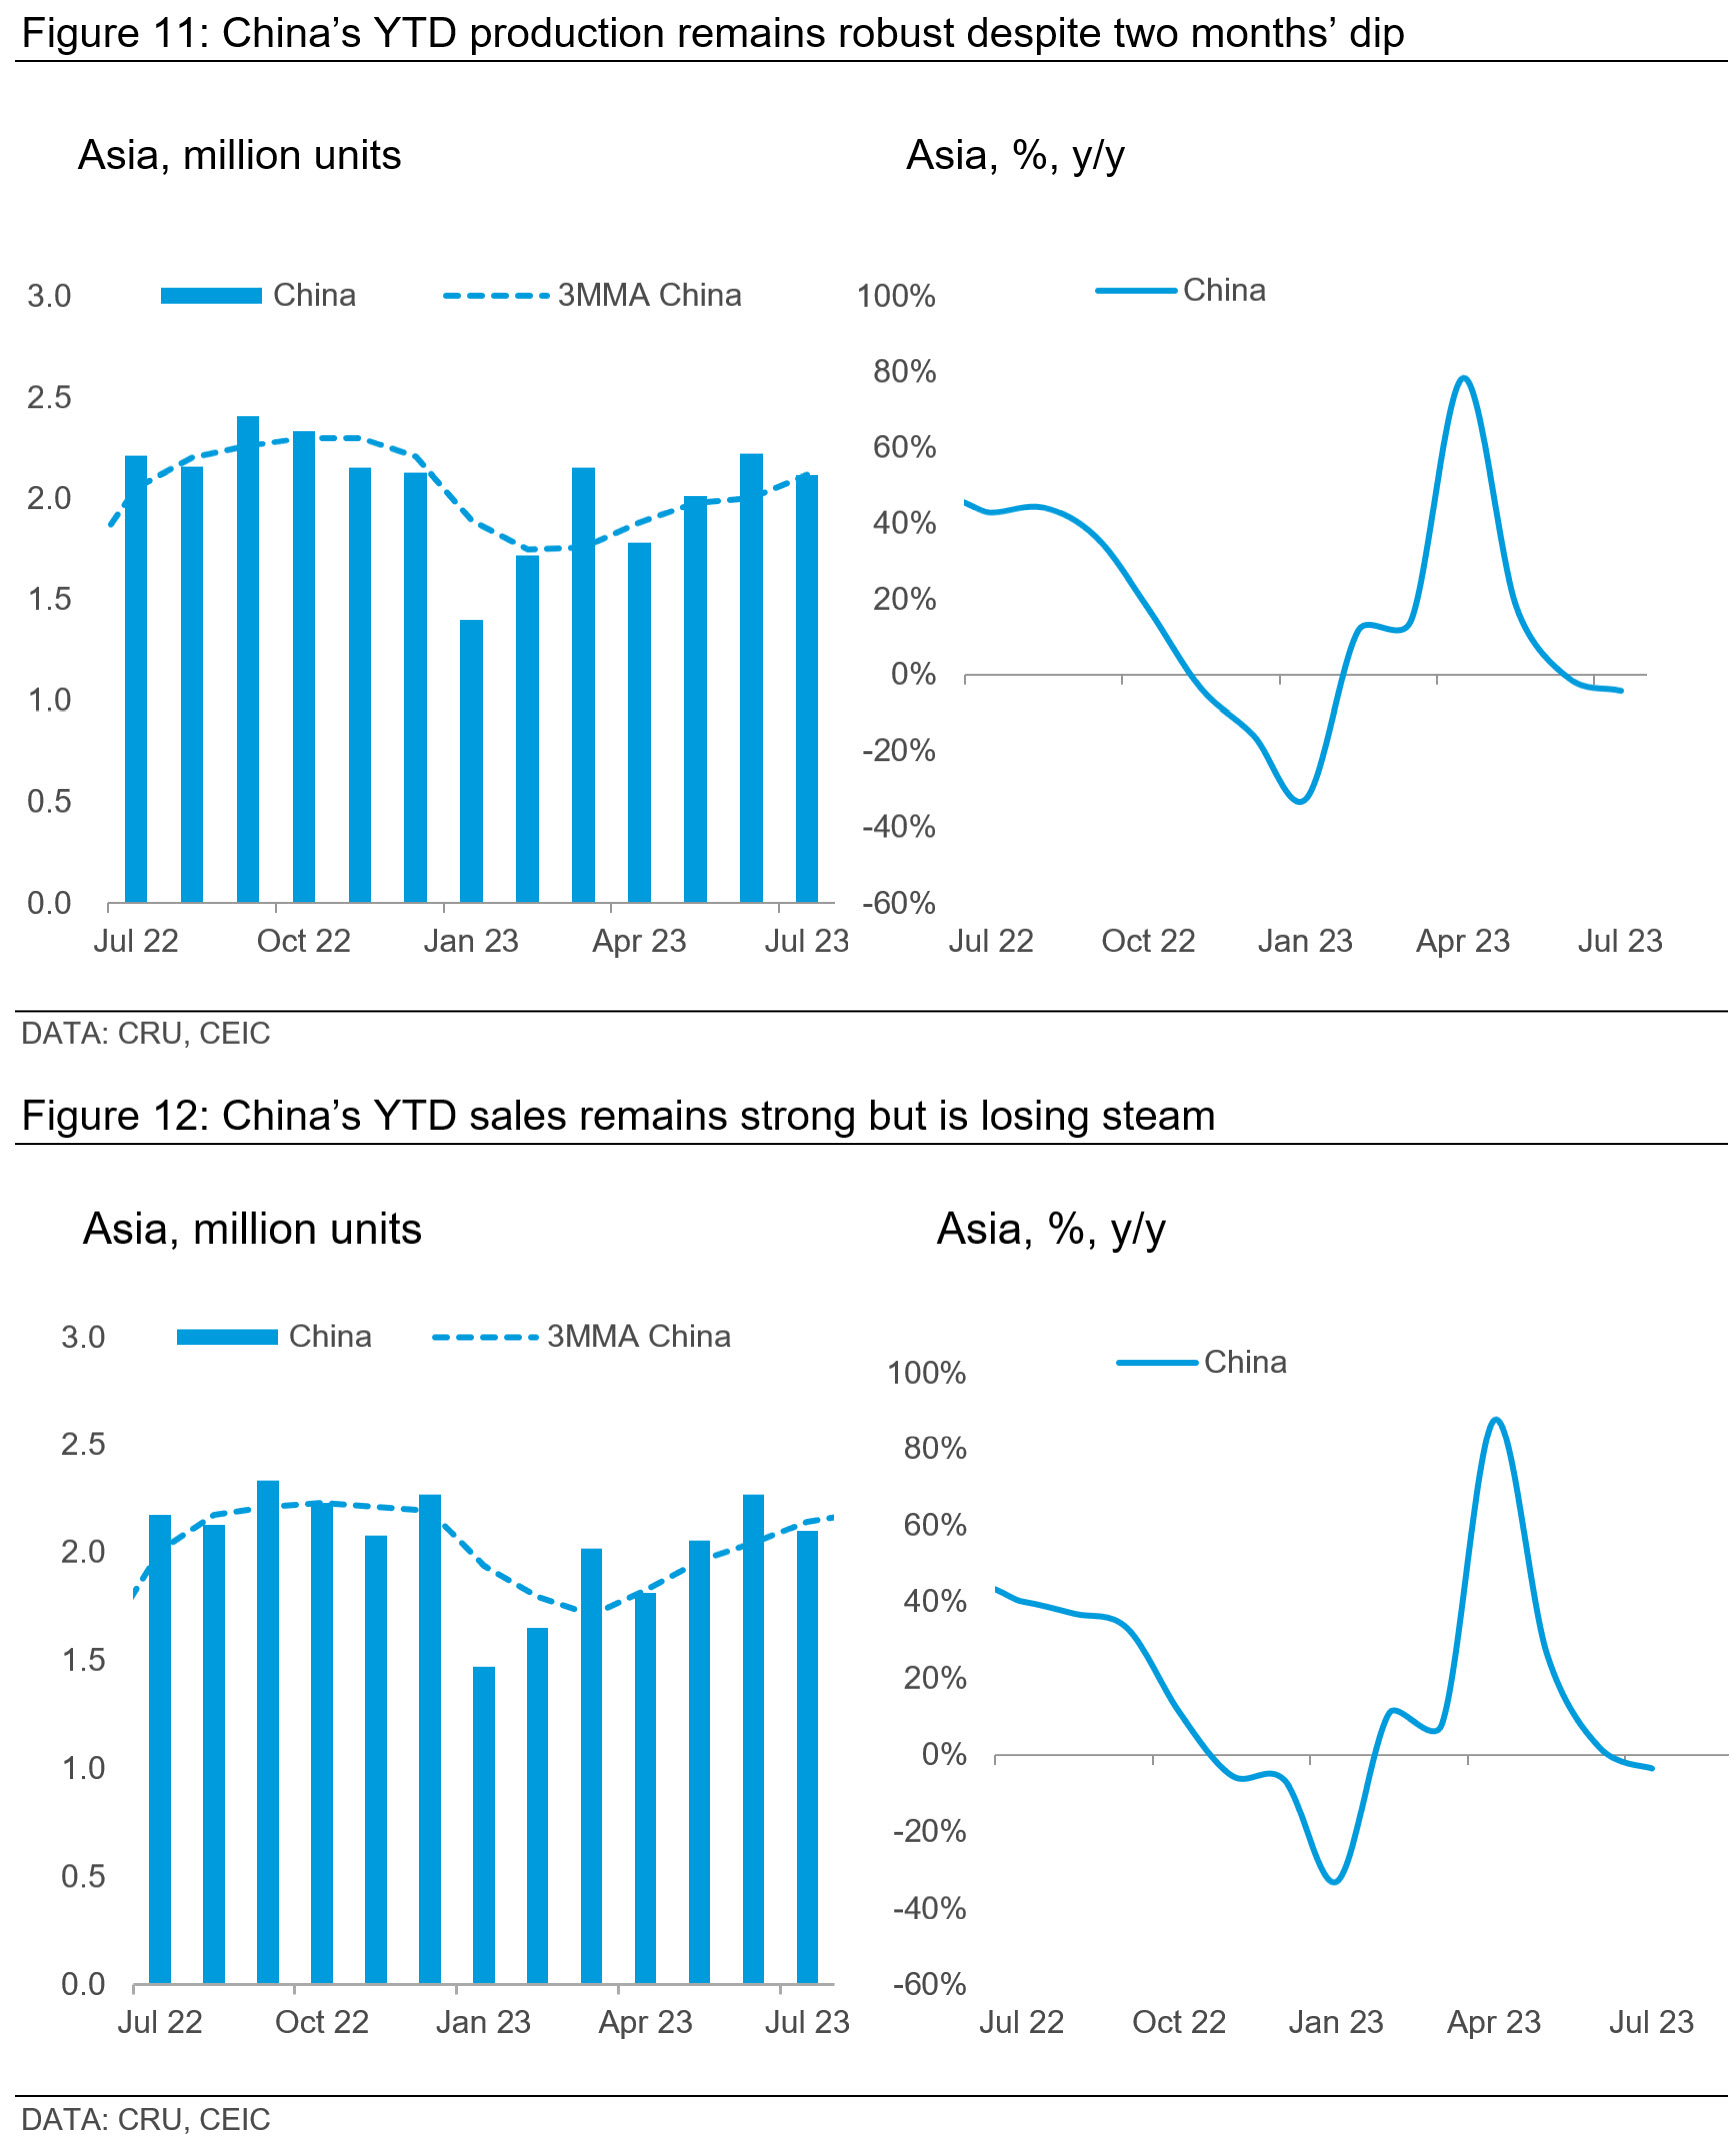
Passenger car production in July saw a year-on-year contraction of 4%, marking the second consecutive month of decline, influenced in part by the demand challenges that continue to hover over the industry, as well as a high comparative base from the previous year. However, despite these setbacks, the YTD figure, 13.4 M units, presents a more optimistic narrative with production growth at approximately 6% y/y. There is also a noticeable slowing in sales, where July saw a 3% y/y decline. YTD figure, 13.4 M units, grew slightly ahead than production at 6.8% y/y. YTD figures of production and sales illuminate the resilience and growth potential of the Chinese market, but it is worth noting a subtle dip of 2.1 pp in these growth rates when compared to the January-June span.
An intriguing development in July was the growth story of commercial vehicles. Bolstered by the low comparative base from 2022, this segment showcased double-digit y/y growth in production and sales (17% and 16.8% respectively). However, the spotlight remains firmly on EVs and car exports, a sector that seems set on an unwavering upward trajectory.
Automakers in China have been increasingly eyeing the global market and making an international presence. In the past month, automakers in China shipped roughly 363 K passenger cars to overseas markets, a 71% y/y increase. YTD exports now stand at 2.3 M units, up 86% y/y. Although ICEs vehicles still make up the majority of exports, the YTD export share of BEVs now stands at an impressive 36%.
The price war has been resurrected after CAAM rebuffed the commitment agreed by 16 automakers to avoid abnormal pricing. Tesla, BYD, SAIC and others slashed prices again in August. We expect another cycle of consolidation in the EV sector.
Explore this topic with CRU