
World trade is not keeping pace with GDP growth
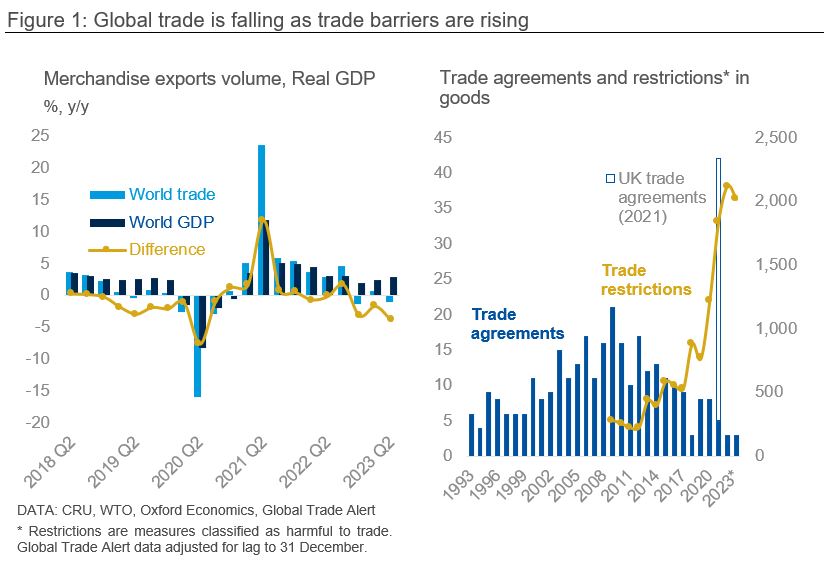
After witnessing a sharp rebound in 2021 as the Covid-19 lockdown measures eased, global merchandise trade flows are now slowing down once more. In the year to 2023 Q2, world trade volumes have contracted by 0.2%, despite world GDP growing by 2.7% (Figure 1, left-hand side). Excluding the pandemic era, the last time international trade flows fell behind the world economy by this magnitude over the same period happened during the 2008 – 2009 global financial crisis.
Cyclical economic headwinds, such as higher financing costs and a slowdown in global consumer demand for goods, are partly behind the slowdown of trade flows. However, protectionism has contributed to the slowdown, and we believe it represents a fundamental and long-term risk for global trade. Sanctions against Russia have complicated many trade flows, but the global trade slowdown has been brewing for some time. The stock of merchandise trade agreements in force has plateaued as the signing of new treaties stalled after peaking in 2009 (Figure 1, right-hand side). To date, less than 50% of global trade happens under a free trade agreement.
Geopolitical fragmentation and the re-shoring agenda will continue to hamper trade
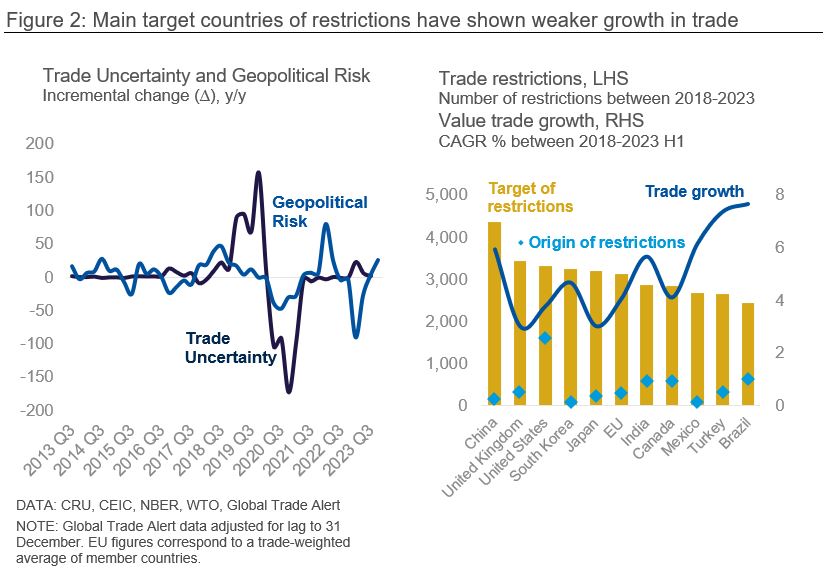
Both the trade uncertainty and geopolitical risk indices spiked between 2018 and 2019 (Figure 2, left-hand side) as trade barriers in goods rose sharply during the US-China trade war. Since then, the US has been the world's lead implementer of trade restrictions, more than doubling Brazil and Canada, its closest peers. China has become the biggest target of world restrictions. Countries with higher restrictions imposed on them over the past five years have experienced lower trade value growth rates over the same period (Figure 2, right-hand side). While trade restrictions have impacted sectors broadly, some commodity classes, such as products of iron and steel, top the list.
The US–China trade tariffs implemented in 2018 remain in place and continue to impact overall trade values between these two countries. Trump has threatened to implement a 10% blanket tariff against all imports if he wins the 2024 US Presidential election. The EU’s Carbon Border Adjustment Mechanism (CBAM), which sets tariffs on carbon-intensive products imported to the trading bloc from non-EU countries, will fully come into effect in 2026. In addition, the EU’s ongoing investigation against China’s EV subsidies points to the risk of further trade barriers. The inclusion of six additional countries to the BRICS bloc announced during its last summit this year also highlights a shift towards a fragmented geopolitical balance, with potential repercussions for trade patterns.
It is not only tariffs that can create barriers to trade. ‘Behind-the-border’ measures – for example, subsidies with local content requirements – can also have major effects on trade flows. The generous tax credits embedded in the US Inflation Reduction Act (IRA) are explicitly designed to re-shore production. The EU’s Green Deal Industrial Plan has opened the door to member states using subsidies to green tech in a similar way. Scarred by the recent supply-chain crisis and by geopolitical risk, many private companies are seeking to prioritise resilience over cost in their global supply chains.
A key question is how these trends will re-configure the trade landscape. The rise of nearshoring (shifting operations or supply chains in geographically closer countries to the main markets) spells trade fragmentation rather than resuming global integration. However, although we expect world trade to slow in the aggregate, there will be winners and losers. Many countries can benefit from the ongoing trade decoupling across the largest blocs.
Explore this topic with CRU