Part of the answer lies in changes in marginal cost of production. This relationship is independent of any change in steelmaking raw materials costs, and any other input cost for that matter. When capacity utilisation is sustained above 85-90%, the pricing regime begins to shift, disassociating from costs and carrying potential to build margins beyond levels changes in marginal costs alone would imply. Our latest view of capacity utilisation implies that China is approaching this threshold.
Higher capacity utilisation offers fundamental support to domestic steel prices
CRU forecasts ongoing increases in Chinese crude steel capacity utilisation as spare capacity is cut further. Our domestic steel price forecasts have been upgraded, and with them, expectations of industry profitability. But why should this be the case – why is there any relationship between capacity utilisation and steel price in the first place?
Impact beyond costs hikes
Rising Chinese capacity utilisation rates imply higher marginal cost of production for domestic steelmakers. Increasing carbon crude steel capacity utilisation, from 84.7% in 2017 to 89.4% in 2020/21 in our latest data, implies an increase of up to $10 /t in marginal costs over this period.
This will provide support domestic steel prices, above and beyond any movement in input costs. In addition, Chinese steel prices have the potential to disassociate from costs, providing further price and margin upside.
Marginal costs are key, most of the time
Much of the time the steel market is highly competitive, as it remains fragmented enough for there to be little pricing power in the hands of producers. Meanwhile, steelmakers act in an economically rational way. This applies to Chinese steelmakers, and previous CRU analysis has shown this to be the case. Chinese steelmakers’ decisions whether increase, hold steady or decrease steel production therefore have often come down to a comparison between two metrics:
- Marginal revenue – additional revenue from selling the next tonne of steel in the market. Most likely this will be a spot sale of commodity or base grade material, often to export markets, because the rest of the mill’s rolling programme will likely have been filled by higher-priced orders.
- Marginal cost – the additional cost incurred to produce the next tonne of steel.
There is a mechanism which tends to cause these two parameters to move in line, that is to say, steel prices follow the marginal cost of production for most of the time – this is:
- If marginal revenue is much greater than marginal cost, it is profit maximising to produce and sell the steel. Such additional production weakens the market supply/demand balance and prices fall as producers compete to sell their additional production in the market by lowering prices.
- If marginal revenue is less than marginal cost, it is profit maximising to not produce any additional steel, or reduce production. This tends to tighten the supply/demand balance and prices rise as steel becomes scarcer and buyers need to bid higher, and/or producers can offer higher.
Cash-focused pricing strategy
In very difficult steel markets, such was the case in late 2015 and early 2016 in China, steel prices can fall very close to marginal costs for a short period of time. As this is the profit-maximising price strategy a steel producer can adopt. But prices will not fall below marginal costs, as this is never profit-maximising behaviour.
Cost-plus pricing strategy
In steady state market conditions when capacity utilisation is less that 85-90%, prices sit a little above marginal cost and move in line with them, because non-production costs, such as selling, general and administrative expenses, need to be recovered in selling prices (i.e. funded from revenues) in the longer run. However, through the above mechanism, prices follow marginal costs and this relationship is shown in the chart below.
At times, prices can rise above levels marginal costs alone would imply, for example in 2008. Reasons for this are dealt with later in this paper. At other times, price fall near to, but not below marginal costs, as seen in 2015 and early 2016. However, for the majority of the time, prices follow marginal costs. So far, so good, but what about the role of capacity utilisation?
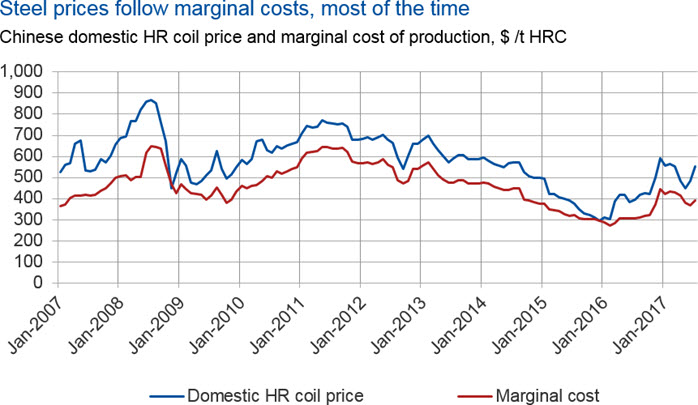
Source: CRU
Marginal cost is a function of capacity utilisation
A key link between steel prices and capacity utilisation through marginal costs is made by realising that marginal costs are a function of capacity utilisation. As utilisation rises to around 60%, marginal costs fall as output (capacity utilisation) increases because fixed costs are spread over more tonnes of output i.e. the share of fixed costs in the next tonne of steel produced is lower than the previous.
Above this threshold the benefits of falling fixed cost per tonne on marginal costs begin to be outweighed by increasing variable costs per tonne. This is because variable costs are dynamic - they can and do vary with output/capacity utilisation.
Variable costs increase because the unit price of certain key inputs increases with output. For example, it starts to become necessary to buy expensive 3rd party pellets, lump and coke. Energy will have to be purchased from outside sources and labour costs rise due to the use of high cost over-time and/or temporary workers as shift patterns change. Increasing output further, above 100% capacity utilisation, equipment begins to be pushed beyond its design limits, maintenance requirements increase exponentially.
This dynamic is summarised in the chart below, illustrating marginal cost per tonne at various levels of capacity utilisation. Overlaid on this are revenue curves for three alternative output scenarios – low, steady-state and high demand.
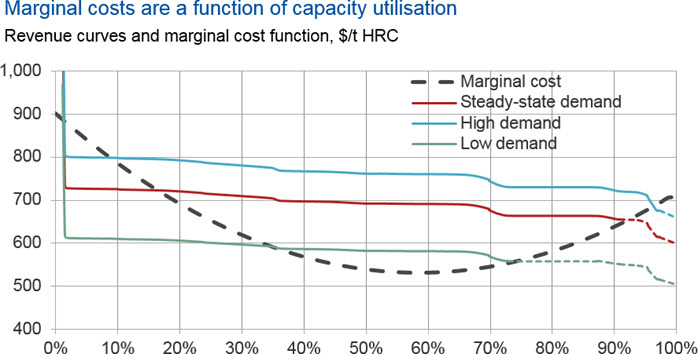
Source: CRU
The revenue curves represent typical revenue per tonne obtained from cumulative mill production. We would expect a small proportion of production to be high-value products, for which the net-realised revenues will be elevated, but volumes will be limited. Net-realised revenues will then diminish across the whole sales portfolio as additional products are subject to greater and greater competitive intensity or they are shipped over greater distances. Although potential sales may exist (dotted lines in the graph above) a steelmaker will not sell steel if the marginal revenue received is less than the marginal cost.
Thus, marginal cost dictates both the price at which the steelmaker is prepared to sell the last tonne of steel and production volume, hence the link with capacity utilisation according to the theory, but what about the practice?
The left-hand chart below proves the relationship between notional EBITDA margin on HR coil sales, and capacity utilisation, showing a clear relationship with an R2 of 0.8.
What’s the price impact?
Above around 60%, higher capacity utilisation means higher marginal costs, which increases prices by the mechanism described above. This effect is independent of prevailing raw materials (base) costs, such as iron ore, coal, other metallic or ferroalloys inputs, as shown in the right-hand chart below where the R2 is very low indicating essentially no correlation.
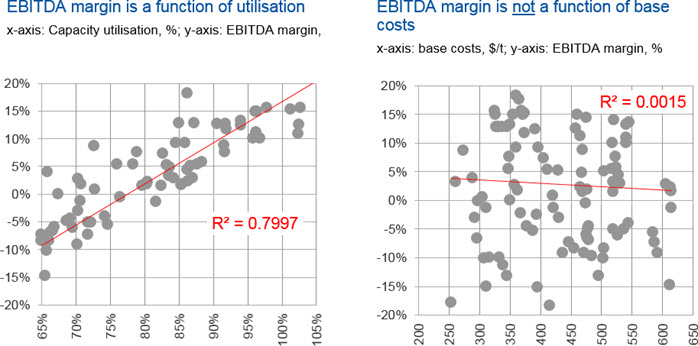
Source: CRU
In terms of carbon crude steel, our estimates and forecasts of capacity utilisation have been upgraded. In our latest data, capacity utilisation increases from 84.7% in 2017 to 89.4% in 2020/21. This alone (i.e. not including any change to base costs) implies a lift in marginal costs of around $10 /t over this period. However, the uplift in steel prices could be more than this for the reasons described below, plus any change in base costs (i.e. steelmaking raw materials, labour and other input costs).
Prices can disassociate from costs
When capacity utilisation is sustained above 85-90%, prices can rise more than changes in marginal costs alone imply. This can happen as mills’ pricing power begins to increase as buyers start to compete for supply - pricing must be high enough to attract supply - because:
- Unplanned outages, which become more likely at higher operating rates, can eat into the 10-15% of spare capacity and result in scarcity of supply or, in extreme cases, physical shortages. They can also have a disproportionate short-term impact on prices as resulting reductions in effective capacity are unanticipated;
- Mill rolling programmes quickly become full and lead times extended. Sellers are then allocating orders on the basis of price i.e. on the basis of bids;
- Marginal costs therefore become irrelevant as mills seek to maximise margins over total costs.
In other words, the basis for pricing changes from cost to allocation– there is a shift from a buyers’ to a sellers’ market. The implication of this is that prices could rise by more than marginal costs alone imply.
In addition, short-term supply disruptions can increase effective capacity utilisation, by temporarily reducing maximum possible production. This year has been a case in point, where maintenance outages have limited the ability to supply to an otherwise eager market, given stronger than expected demand in Q2 and Q3.
In addition, there have been unplanned outages, most recently given a blast furnace fire in northern China, and other smaller incidents in Hebei province in the same week. Also, production controls for environmental reasons, which are sometimes temporary (for example around an international event when “blue skies” are required) also work to reduce effective capacity. These will all drive prices higher than changes in marginal costs alone imply.
The impact of changes in capacity utilisation, resulting marginal cost effects, changes in underlying raw material (base) costs and other supply/demand effects are taken into consideration in CRU’s steel price forecasts. Our most recent forecasts will therefore come to reflect our latest view of capacity utilisation, overlaid with factors specific to individual finished products.
Higher prices, higher profitability
As we have seen, EBITDA margin is independent of base production costs, but is related to capacity utilisation in the ways described above. Higher prices and better domestic margins resulting from improved capacity utilisation will then tend to help retain steel in the domestic market, to which the majority of production serves in any case.
Together with the strength of markets elsewhere and cost competitiveness, home market strength in these terms is one of the three principal factors impacting export volumes. In other words, exports tend to fall when the domestic market is performing well and rise when performing poorly, all other things being equal. This is the subject of the next Insight in this series exploring the result of improvements in Chinese capacity utilisation, to be published next week.
Explore this topic with CRU